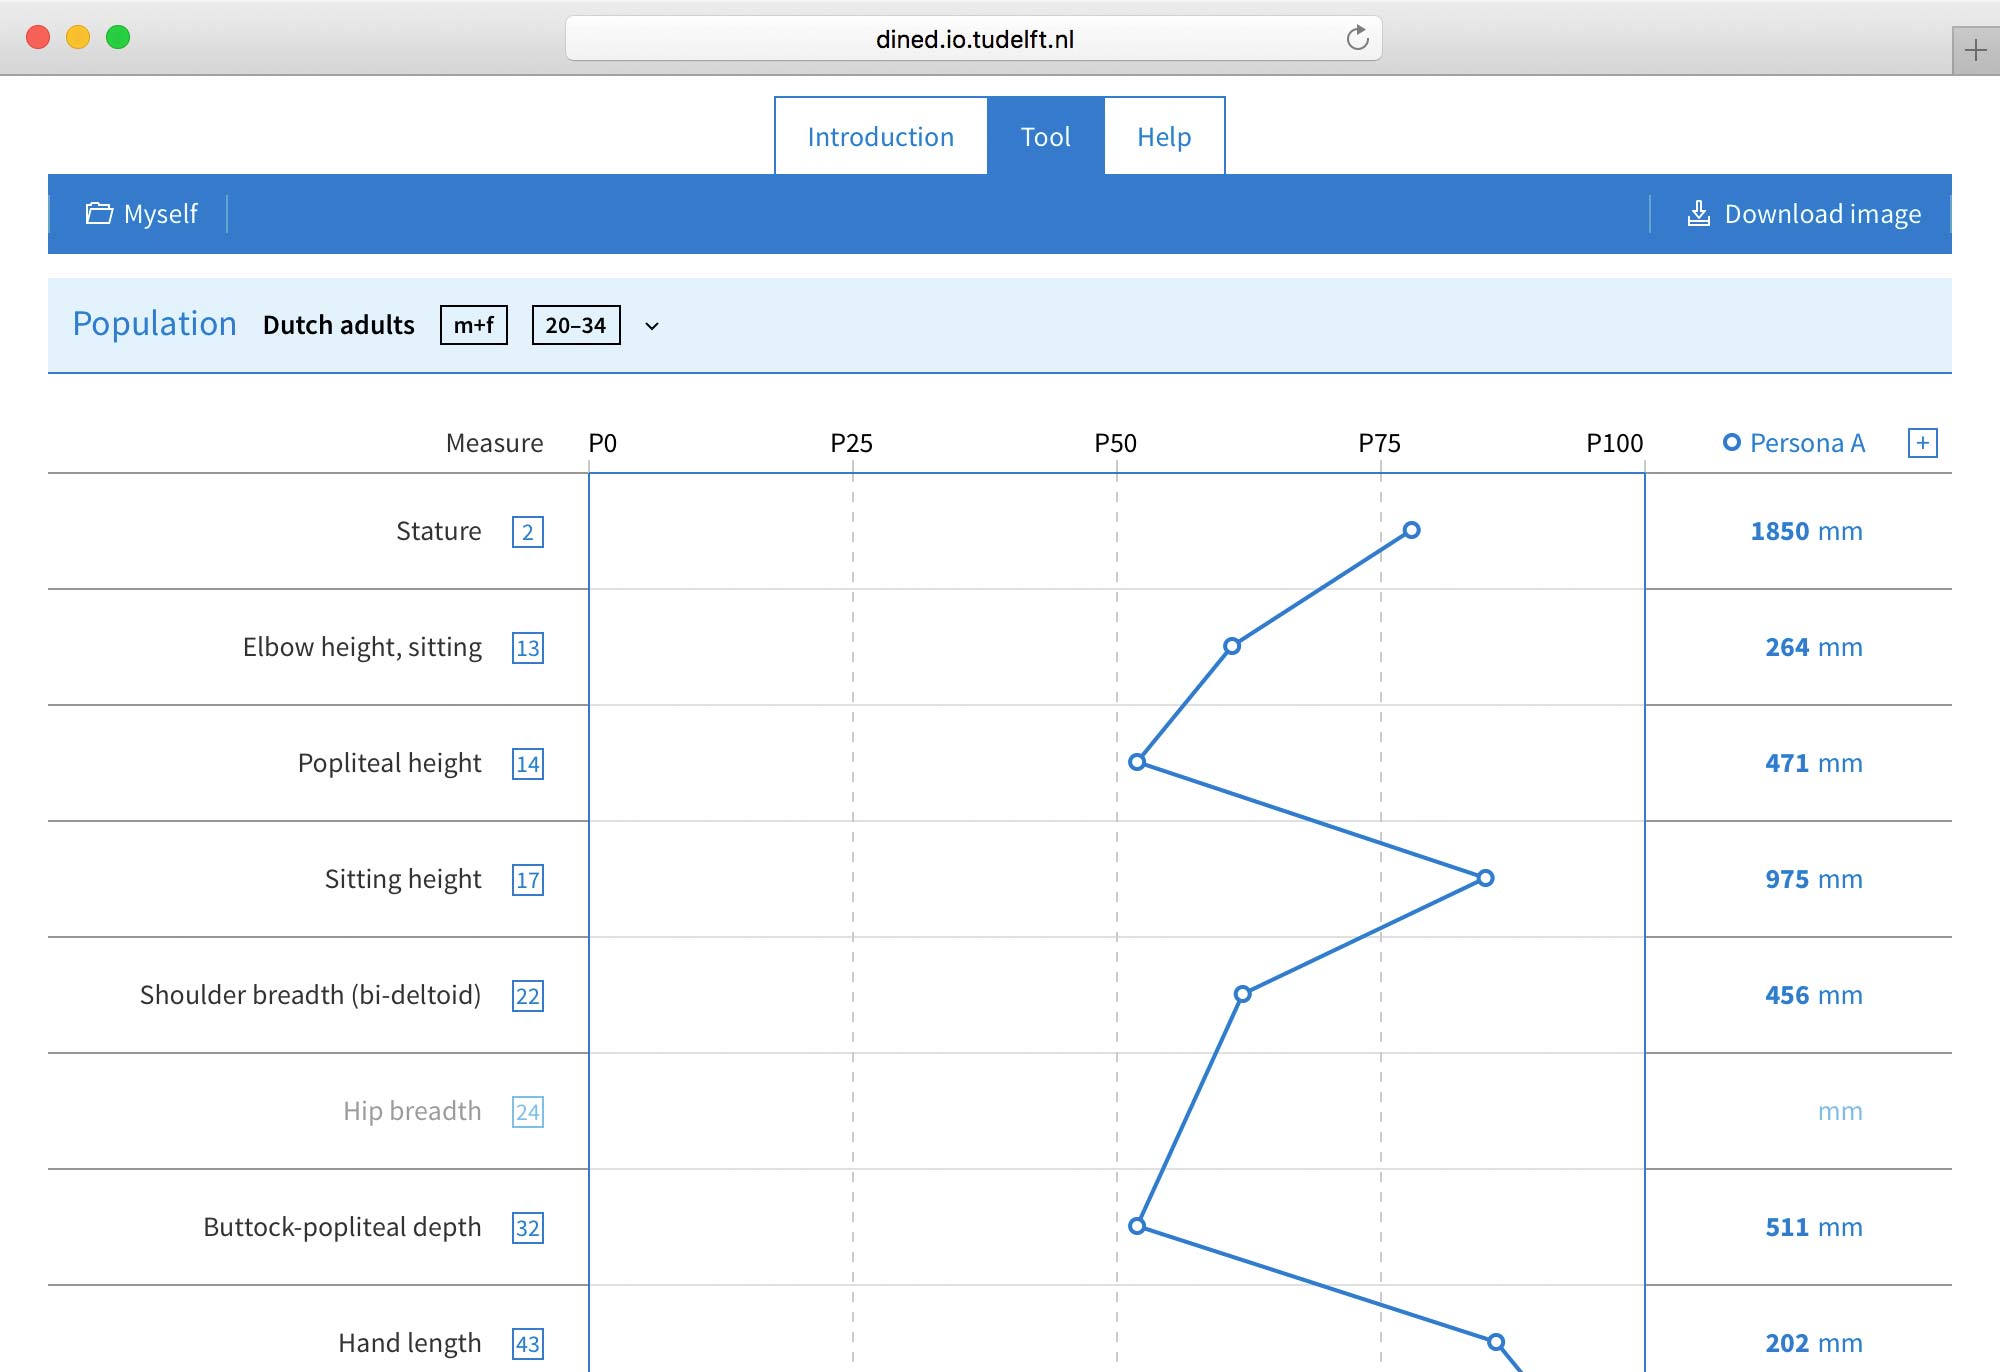
3d-pan-icon3d-rotate-icon3d-side-bottom3d-side-front-icon3d-side-top3d-zoom-iconadd-user-iconcog-icondownload-iconemail-iconfolder-iconkey-iconlock-iconmenu-iconpercentage-iconplus-iconpopup-iconsmall-icon-chevron-downsmall-icon-chevron-rightsmall-icon-chevron-upsmall-icon-minusstudy-icontrash-iconuser-iconwrench-icon

Profiler

Profiler allows you to compare somebody — or a persona — to a population and to other people.

Save multiple profiles online for reference or to work on at a later time. Your current analysis is always saved.
Download images of your profiles for inclusion in your documents. SVG images allow you to further edit them.
Profiler
You can select from a variety of populations. Filters allow you to select specific age groups.
The scatter plot shows you how your different personas compare to the population. You may discover majors differences between measures.

Studies

  • Dutch adults

    2004 dined2004

    The most recent version of the DINED-series was based on two sources. The first is the Geron-project 1993-1998 of the TU Delft Ergonomics group (see also the Geron 1998 table), which provides the basic body dimensions. Second source is the Caesar-project

    Age groups

    This study allows setting specific age limits for your analysis:

    • Custom group between ages 20 and 94

    Additionally, this study provides the following preset age groups:

    • 20–30
    • 31–60
    • 60+
    • 20–60

    People involved

    • Dirken, TUD
    • Steenbekkers, WUR
    • Daanen, TNO
    • Voorbij NEN
    • Molenbroek, TUD

    Related publications

  • Dutch adults

    2003 dined2003

    Dined 2003 was a joint project from TU Delft and TNO Human Factors. It focuses on the basic body dimensions (no cicumferences) and aims at giving a reliable estimation of the Dutch population by combining two sources for these dimensions.

    Age groups

    The population in this study is divided into the following age groups:

    • 18–30
    • 31–65
    • 65–80

    People involved

    • Dr Hein A.M.Daanen
    • Arno J. Krul
    • Dr Johan F.M. Molenbroek

    Related publications

    • DINED 2003 by H.A.M. Daanen, A.J.Krul and J.F.M. Molenbroek. Uitgeverij Kerckebosch, Zeist 2003
    • Steenbekkers, LPA and van Beijsterveldt et al. Design Relevant characteristics of ageing users. TUDelft, 1998
  • Dutch adults

    1982 dined1982

    The original DINED dataset from 1982 was used for more then 20 years as a standard in furniture industry and was published as appendix from NPR1813 by the NEN.

    Age groups

    The population in this study is divided into the following age groups:

    • 20–60

    People involved

    • Molenbroek JFM
    • JM Dirken

    Related publications

    • Nederlandse lichaamsmaten voor ontwerpen, DINED tabel by JFM Molenbroek. Tijdschrift voor ergonomie, volume 11 (1986), issue 4, page 16-19
    • Nederlandse lichaamsmaten voor ontwerpen, DINED tabel, derde herziene editie by JFM Molenbroek and JM Dirken. TU Delft, 1986
    • Nederlandse Praktijkrichtlijn NPR 1813, Ergonomie ? Ergonomische uitgangspunten voor kantoormeubelen en aanwijzingen voor gebruik - Toelichting bij NEN 1812 en 2449 by NEN, 1990
    • Poly-technisch zakboekje by Ir. PHH Leijendeckers, Ing. MCM van Maarschalkerwaart, Prof.Ir. JE Rijnsdorp and Ir. Sj. Tytsma. P.B.N.A., 1987
  • Dutch elderly

    1998 geron1998

    The TU Delft Geron project was a national study in which 750 subjects, who lived independently, were assessed. In total about 80 variables, all more or less important for product use, were measured. The sample consisted of four age groups ranging from 50

    Age groups

    This study allows setting specific age limits for your analysis:

    • Custom group between ages 50 and 94

    Additionally, this study provides the following preset age groups:

    • 50–54
    • 55–59
    • 60–64
    • 65–69
    • 70–74
    • 75–79
    • 80+

    People involved

    • C.E.M. van Beijsterveldt
    • J.M.Dirken (Project leader)
    • J.J.Houtkamp
    • J.F.M.Molenbroek
    • L.P.A. Steenbekkers
    • A.I.M.Voorbij

    Related publications

    • L.P.A. Steenbekkers, C.E.M. van Beijsterveldt (eds), J.M.Dirken, J.F.M.Molenbroek, A.I.M. Voorbij and J.J. Houtkamp Design-relevant characteristics of ageing users, Delft University Press 1998 (per 1-1-2006 IO-Press Amsterdam)
  • Dutch children

    1993 kima1993

    Age groups

    This study allows setting specific age limits for your analysis:

    • Custom group between ages 2 and 13

    Additionally, this study provides the following preset age groups:

    • 2
    • 3
    • 4
    • 5
    • 6
    • 7
    • 8
    • 9
    • 10
    • 11
    • 12

    People involved

  • Dutch elderly

    1984 gdvv1984

    This data was measured in 1982 in cooperation with Gemeentelijke Dienst Verpleging en Verzorging, the association for elderly care and housing in The Hague.

    Age groups

    This study allows setting specific age limits for your analysis:

    • Custom group between ages 53 and 106

    Additionally, this study provides the following preset age groups:

    • 53+

    People involved

    • J.F.M. Molenbroek
    • J.J. Houtkamp
    • A.K.C. Burger

    Related publications

    • Anthropometry of elderly people in the Netherlands; research and applications by JFM Molenbroek. Applied Ergonomics, volume 18 (1987), issue 3, page 187-199
    • IO bijzondere onderwerpen 16, bejaardenanthropometrie by JFM Molenbroek, JJ Houtkamp and AKC Burger. Technische Hogeschool Delft, 1983
  • Dutch Growth

    growthdiagrams

    This data gives the grow diagrams of children from 0 to 21 years measured in the Netherlands in 1955, 1965, 1980 and 1997. The first two studies included about 40.000 children.

    Age groups

    The population in this study is divided into the following age groups:

    • 1 month
    • 2 months
    • 3 months
    • 4 months
    • 5 months
    • 6 months
    • 7 months
    • 8 months
    • 9 months
    • 10 months
    • 11 months
    • 12 months
    • 13 months
    • 14 months
    • 15 months
    • 1.5
    • 2
    • 2.5
    • 3
    • 3.5
    • 4
    • 5
    • 6
    • 7
    • 8
    • 9
    • 10
    • 11
    • 12
    • 13
    • 14
    • 15
    • 16
    • 17
    • 18
    • 19
    • 20
    • 21

    People involved

    • A.M. Fredriks
    • S. van Buuren
    • R.J.F Burgmeijer
    • S.P. Verloove-Vanhorick
    • J.M. Wit

    Related publications

    • Groeidiagrammen handleiding bij het meten en wegen van kinderen en het invullen van groeidiagrammen. TNO/LUMC, Leiden, 2002
  • Dutch students

    2016 delstu2016

    This study contains measurements of 347 Dutch students taking part in the first year of the Industrial Design Engineer Bachelor's programme at TU Delft. Measurements were conducted in 2014 in the traditional way, with calipers and tape in combination with

    Age groups

    This study allows setting specific age limits for your analysis:

    • Custom group between ages 17 and 27

    Additionally, this study provides the following preset age groups:

    • 17–27

    People involved

    • Wytske de Jong
    • Titus Lotgerink
    • Matthijs van Leeuwen
    • Karlien Berghman
    • Lucas van den Elshout
    • Johan Molenbroek

    Related publications

    • To be published
  • Dutch students

    1986 delstu1986

    This study is the result of a third year practicum with Delft Industrial Design Engineering students, measurements on students are done in three successive years.

    Age groups

    This study allows setting specific age limits for your analysis:

    • Custom group between ages 19 and 36

    Additionally, this study provides the following preset age groups:

    • 19–36

    People involved

    • J.F.M. Molenbroek

    Related publications

    • Op maat gemaakt. Menselijke maten voor het ontwerpen en beoordelen van gebruiksgoederen. by JFM Molenbroek (Doctoral thesis). Delft University of Technology, 1994
  • International

    1989 international

    Results from a literature study in which the world is divided in 20 regions.

    Age groups

    The population in this study is divided into the following age groups:

    • International
    • North American
    • Latin American (Indians)
    • Latin American (rest)
    • North Europe
    • Central Europe
    • Eastern Europe
    • South East Europe
    • France
    • Spain and Portugal
    • North Africa
    • West Africa
    • South East Africa
    • Middle East
    • North India
    • South India
    • North Asia
    • South China
    • South East Asia
    • Australia (european)
    • Japan

    People involved

    • H.W. Juergens
    • I.A. Aaune
    • U. Pieper
    • J.F.M. Molenbroek

    Related publications

    • International data on anthropometry by Juergens et al., ILO, Geneve, 1989
  • Chilean children

    2012 chile2012

    This is research was carried out by The Universidad de Valparaiso. The sample is from 3.046 students, with ages ranging from 6 to 18 years old, from basic and secondary schools in the Valparaiso Region, Chile. This is part of a project regarding School fu

    Age groups

    The population in this study is divided into the following age groups:

    • 6
    • 7
    • 8
    • 9
    • 10
    • 11
    • 12
    • 13
    • 14
    • 15
    • 16
    • 17
    • 18

    People involved

    • Ignacio Castellucci
    • Carlos Viviani
    • Monica Catalan
    • Jimena Rojas
    • Pedro Arezes
    • Johan Molenbroek
  • CAESAR (NL)

    2000 caesar

    The dataset from the CAESAR Project, with measurements conducted from 1998 until 2000 in Europe, North America. The ages of the subjects are between 18 and 65, but shown here as 99.

    Age groups

    This study allows setting specific age limits for your analysis:

    • Custom group between ages 18 and 66

    Additionally, this study provides the following preset age groups:

    • 18–66
    • 18–30
    • 31–50
    • 51–66

    People involved

    Related publications

  • CAESAR (USA)

    2000 caesar-usa

    The dataset from the CAESAR Project, with measurements conducted from 1998 until 2000 in Europe, North America. The ages of the subjects are between 18 and 65, but shown here as 99.

    Age groups

    This study allows setting specific age limits for your analysis:

    • Custom group between ages 99 and 99

    Additionally, this study provides the following preset age groups:

    • 99

    People involved

    Related publications

  • CAESAR (IT)

    2000 caesar-it

    The dataset from the CAESAR Project, with measurements conducted from 1998 until 2000 in Europe, North America. The ages of the subjects are between 18 and 65, but shown here as 99.

    Age groups

    This study allows setting specific age limits for your analysis:

    • Custom group between ages 99 and 99

    Additionally, this study provides the following preset age groups:

    • 99

    People involved

    Related publications

  • Chilean workers

    2016 chile2016-workers

    This is research was carried out by The Universidad de Valparaiso. The dimensions were taken from a sample of 2,946 workers (Female: 600 and Male: 2,346), from the Valparaiso and Metropolina regions in Chile.

    This research was funded by Mutual de S

    Age groups

    The population in this study is divided into the following age groups:

    • 18–99

    People involved

    • Ignacio Castellucci (Universidad de Valparaíso)
    • Carlos Viviani (Universidad de Playa Ancha)
    • Marta Martínez (Mutual de la Camara Chilena de la Construcción)
    • Pedro Arezes (Universidade do Minho)
    • Johan Molenbroek (TU Delft)
    • Gonzalo Bravo
    • Verónica Aparici (Universidad Viña del Mar)
    • Sara Bragança (Southampton Solent University)
    • Italo Mercurino
    • Romina Zamorano
    • Alvaro Villanueva
    • Soraya Sabaj
    • Felipe Llanca
  • Dutch children, 0.5-7.0 years (NL)

    2019 goto2019

    The dataset from the PhD Project of Lyé Goto with measurements conducted from 2013 until 2015 in The Netherlands. The data only includes the head region of the subjects.

    Age groups

    This study allows setting specific age limits for your analysis:

    • Custom group between ages 1 and 8

    Additionally, this study provides the following preset age groups:

    • 0.5–7
    • 1–2
    • 2–3
    • 3–4
    • 4–5
    • 5–6
    • 6–7
    • 7–8

    People involved

    Lyé Goto

    Related publications