Selecting population & measures
Using Ellipse starts by selecting relevant populations and measures.
Selecting a population
- In the "Population" section of the sidebar, click the currently selected population or "Select a population".
- Select a study that represents the right population by clicking one in the list.
-
If you have not selected two measures yet or if any of the previously selected measures are unavailable for the population, you will be shown the list to select measures.
Note: Studies approximate the population they represent using a sample. Various factors including sample size, age distribution and sex ratio may affect the validity of results.
Note: Populations with a lock icon next to their name are locked. To use these populations you need to sign in or create a free account.
Filtering a population by sex
- In the "Population" section of the sidebar, click the currently selected population or "Select a population".
- Select either "male" or "female" to limit the population to either sex or select "mixed" to include both male and female individuals.
Note: Data for mixed populations assumes an equal distribution between male and female individuals (unless the study uses a different distribution). This may not be the population's true ratio of men and women.
Filtering a population by age
- In the "Population" section of the sidebar, click the currently selected population or "Select a population".
- Do any of the following:
- Select an age group.
- Use the range slider to select a custom age range.
Selecting measures
- In the "Measures" section of the sidebar, click the currently selected measure or "Select a measure" for the axis you wish to change.
- Click any of the measure groups in the right column to view the available measures.
- Select a measure by clicking one in the graphic or in the list. Measures available for the selected population have a blue border. Note: Not all measures might be shown in the graphic. Additional measures are shown in a list below the graphic.
-
If you have not selected a population yet, you will be shown the list to select a population. If you have not selected the measure for the other axis yet, you will be shown the list to select the other measure.
- Selecting a measure that is also selected for the other axis will switch the axes instead of selecting the same measure for both axes.
Note: Measures with a lock icon instead of a number or with a lock icon next to their name are locked. To use these measures you need to sign in or create a free account.
Looking up background information on populations and measures
- In the "Population" or "Measures" section of the sidebar, click any selected population or measure.
- Information on the currently selected measure or population is displayed next to the list or graphic. To view information on another population or measure, hover the pointer over that population or measure.
Undoing and redoing changes
- Press the Control + Z keys (Command + Z on macOS) to undo any changes.
- Press the Control + Y keys (Command + Shift + Z on macOS) to redo any changes that have been undone.
Note: You can undo any changes you make to your analysis. This includes changes to boxes as well as the population and measures.
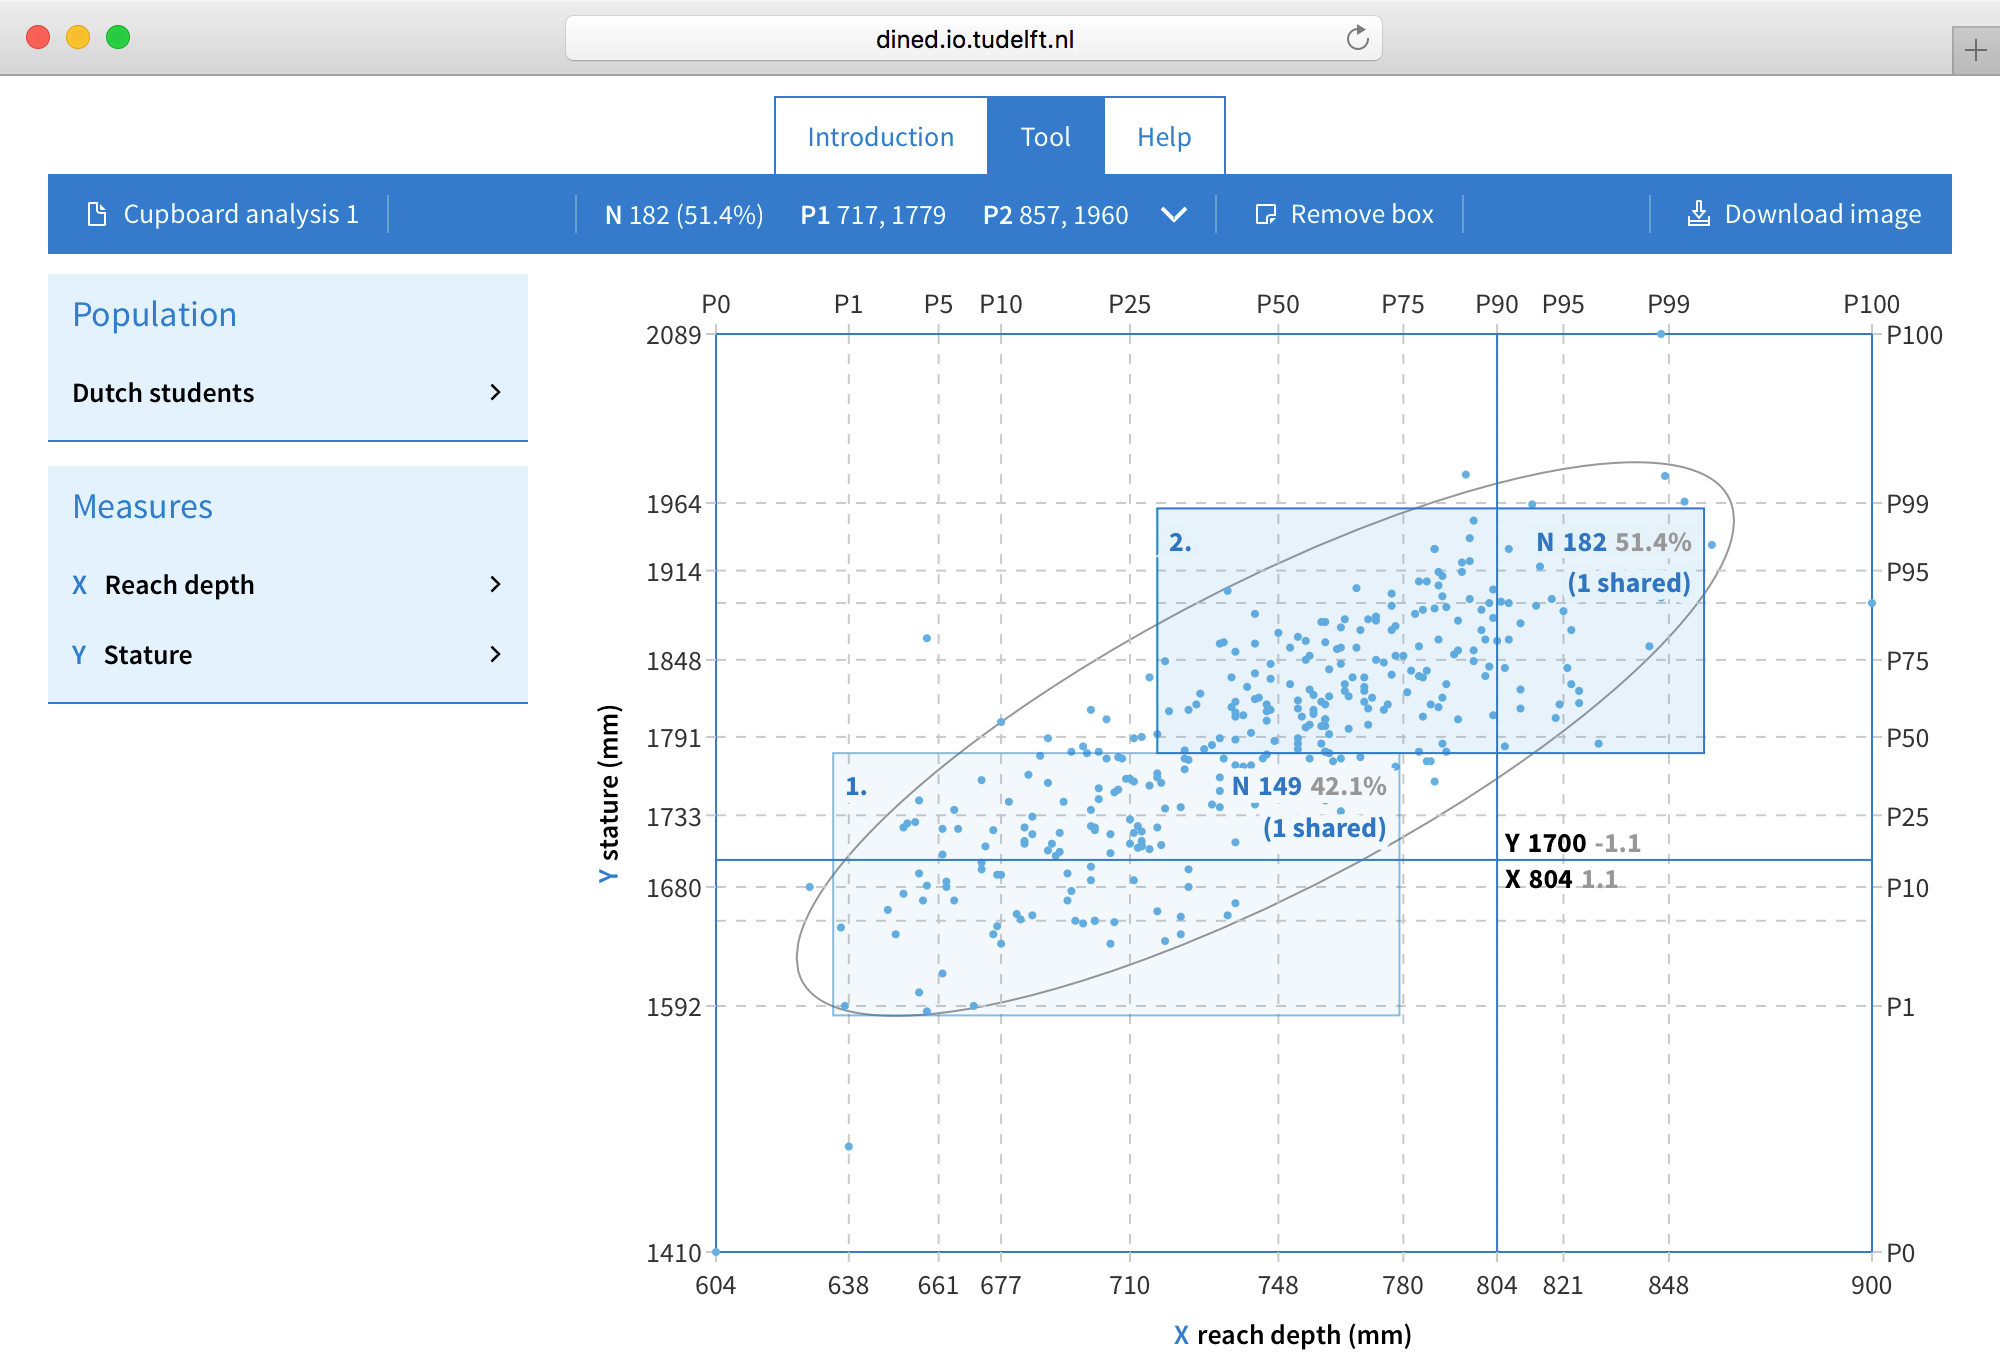
Reviewing data
After selecting a population and two measures, Ellipse will draw a scatter plot as well as a covariance error ellipse. Hovering over the chart will show the x and y values of the point both in the measure's unit as well as in standard deviations from the mean.
Using boxes and points
To analyse, compare and present the data, Ellipse allows you to draw annotations over the scatter plot. Two types of annotation can be drawn:
- Points, can be used to represent a single person from your own measurements.
- Boxes, allow you to see what percentage of the population fits certain measurements. Boxes also show the amount of data points in it and the amount of data points shared with other boxes if a box overlaps with another box.
All annotations added to the plot are also displayed in the "Annotations" section of the sidebar.
Adding an annotation
-
To draw a box:
- Drag from any point in the plot to another to create a box between the two points.
-
To draw a point:
- Click anywhere in the plot to create a point in that position.
Note: If an annotation is currently selected (it will appear highlighted in the sidebar list) deselect the annotation by clicking anywhere outside the box.
Note: While drawing, the cursor will automatically snap to other boxes and points.
- To add an annotation with exact values (measured or percentiles):
- Click the Add box or Add point button in the "Annotations" section of the sidebar.
-
If you want to enter the box or point dimensions/position in percentiles instead of the measurement's unit, click Percentile in the popover.
- Enter the X and Y values (or X and Y ranges, when adding a box) in the popover.
Switching between percentile and measurement input values
By default, annotations are drawn based on measurement values (in the quantity belonging to the axis' measure). However it is also possible to use percentile values as input. To toggle between the two:
- Click the annotation for which you want to switch the input method in the "Annotations" section of the sidebar.
- Click the desired input method (Percentile or Measurement).
- Existing input values are automatically converted.
Note: Percentile input values are always rounded to the nearest integer. Annotations may therefore appear to jump when dragged across the plot.
Note: When using percentile input values, boxes may appear to change in size when dragged as the percentile ranges are kept unchanged.
Editing the position and size of an annotation
-
To move an annotation:
- Drag the annotation. Note: dragging the edges of boxes will cause them to be resized.
-
To resize a box:
- Drag any edge or corner.
-
To enter exact values:
- Click the annotation in the "Annotations" section of the sidebar.
- Enter the X and Y values (or X and Y ranges, when adding a box) in the popover.
Note: While dragging, the cursor will automatically snap to other boxes and points.
Note: If an annotation is set to use percentile input values it may jump when dragged across the plot as percentile values are rounded to the nearest intgeer.
Note: If a box is set to use percentile input values, it may appear to change in size when dragged as the percentile ranges are kept unchanged.
Editing the appearance of an annotation
- Click the annotation in the "Annotations" section of the sidebar. A popover will open.
- Do any of the following:
- Change the annotation's label by changing the text in the display field.
- Change the colour of the annotation by clicking any of the colours under Appearance.
-
If the annotation is a point, change the shape of the point by clicking any of the shapes under Appearance.
Removing an annotation
- Do any of the following:
- Select the annotation by clicking it in the plot.
- Select the annotation by clicking it in the "Annotations" section of the sidebar
- Do any of the following:
- Click the - button in the sidebar.
- Press the Delete key (Backspace key on macOS).
Undoing and redoing changes
- Press the Control + Z keys (Command + Z on macOS) to undo any changes.
- Press the Control + Y keys (Command + Shift + Z on macOS) to redo any changes that have been undone.
Note: You can undo any changes you make to your analysis. This includes changes to boxes as well as the population and measures.
Looking up details on the selected data
-
If nothing is selected:
- Statistical information about the population and two measures is displayed in the toolbar
- Click the information in the toolbar to see additional information
-
If a box is selected:
- Detailed information about the selected box is displayed in the toolbar
- Click the information in the toolbar to see additional information (including information about the analysis)
Saving analyses & downloading results
Ellipse makes it easy to use your analyses in your projects. You can save analyses to review or edit them later and you can download the plots you create as images to include in documents or presentations.
Downloading an image
- Click the download image button in the toolbar.
- Select the type of image to download.
- Enter width and height values for the image. Note: adjusting the width and height will affect the scale of the chart in SVG images, for PNG images scale is fixed.
- Click the download button.
- Depending on your browser, the graph image will download or you may need to manually save the image using your browser's save or save as command.
Saving your analysis
- To save a single analysis on your current computer:
- Ellipse will automatically save your analysis whenever you close or leave the page. Note: your analysis will not be saved if your are using your browser's 'Private browsing' mode.
- To save one or multiple analyses that you may access by logging in:
- Click the analysis button in the toolbar.
-
If you have not already done so, or if you want to change the name, choose a name for your analysis.
- Click the save button.
Viewing a saved analysis
- Click the analysis button in the toolbar.
- Select any analysis in the list.
- Click the view button.
Duplicating an analysis
- Click the analysis button in the toolbar.
- Choose a new name for your analysis.
- Click the save copy button.
Reverting an analysis to an older version
An analysis manually saved in your account may be reverted to the last manually saved version.
- Click the analysis button in the toolbar.
- Look at the last saved date to see when the document was last saved manually.
- Click the revert to last saved button to revert it to this version.