Introduction
Mannequin is a user-friendly tool for 3D surface anthropometry. The platform allows designers, without the need for an engineering background, to comprehensively explore 3D shape variation from a database of 3D scans and to create 3D design manikins that can be downloaded and further employed in computer-aided design software for product sizing.
Panels
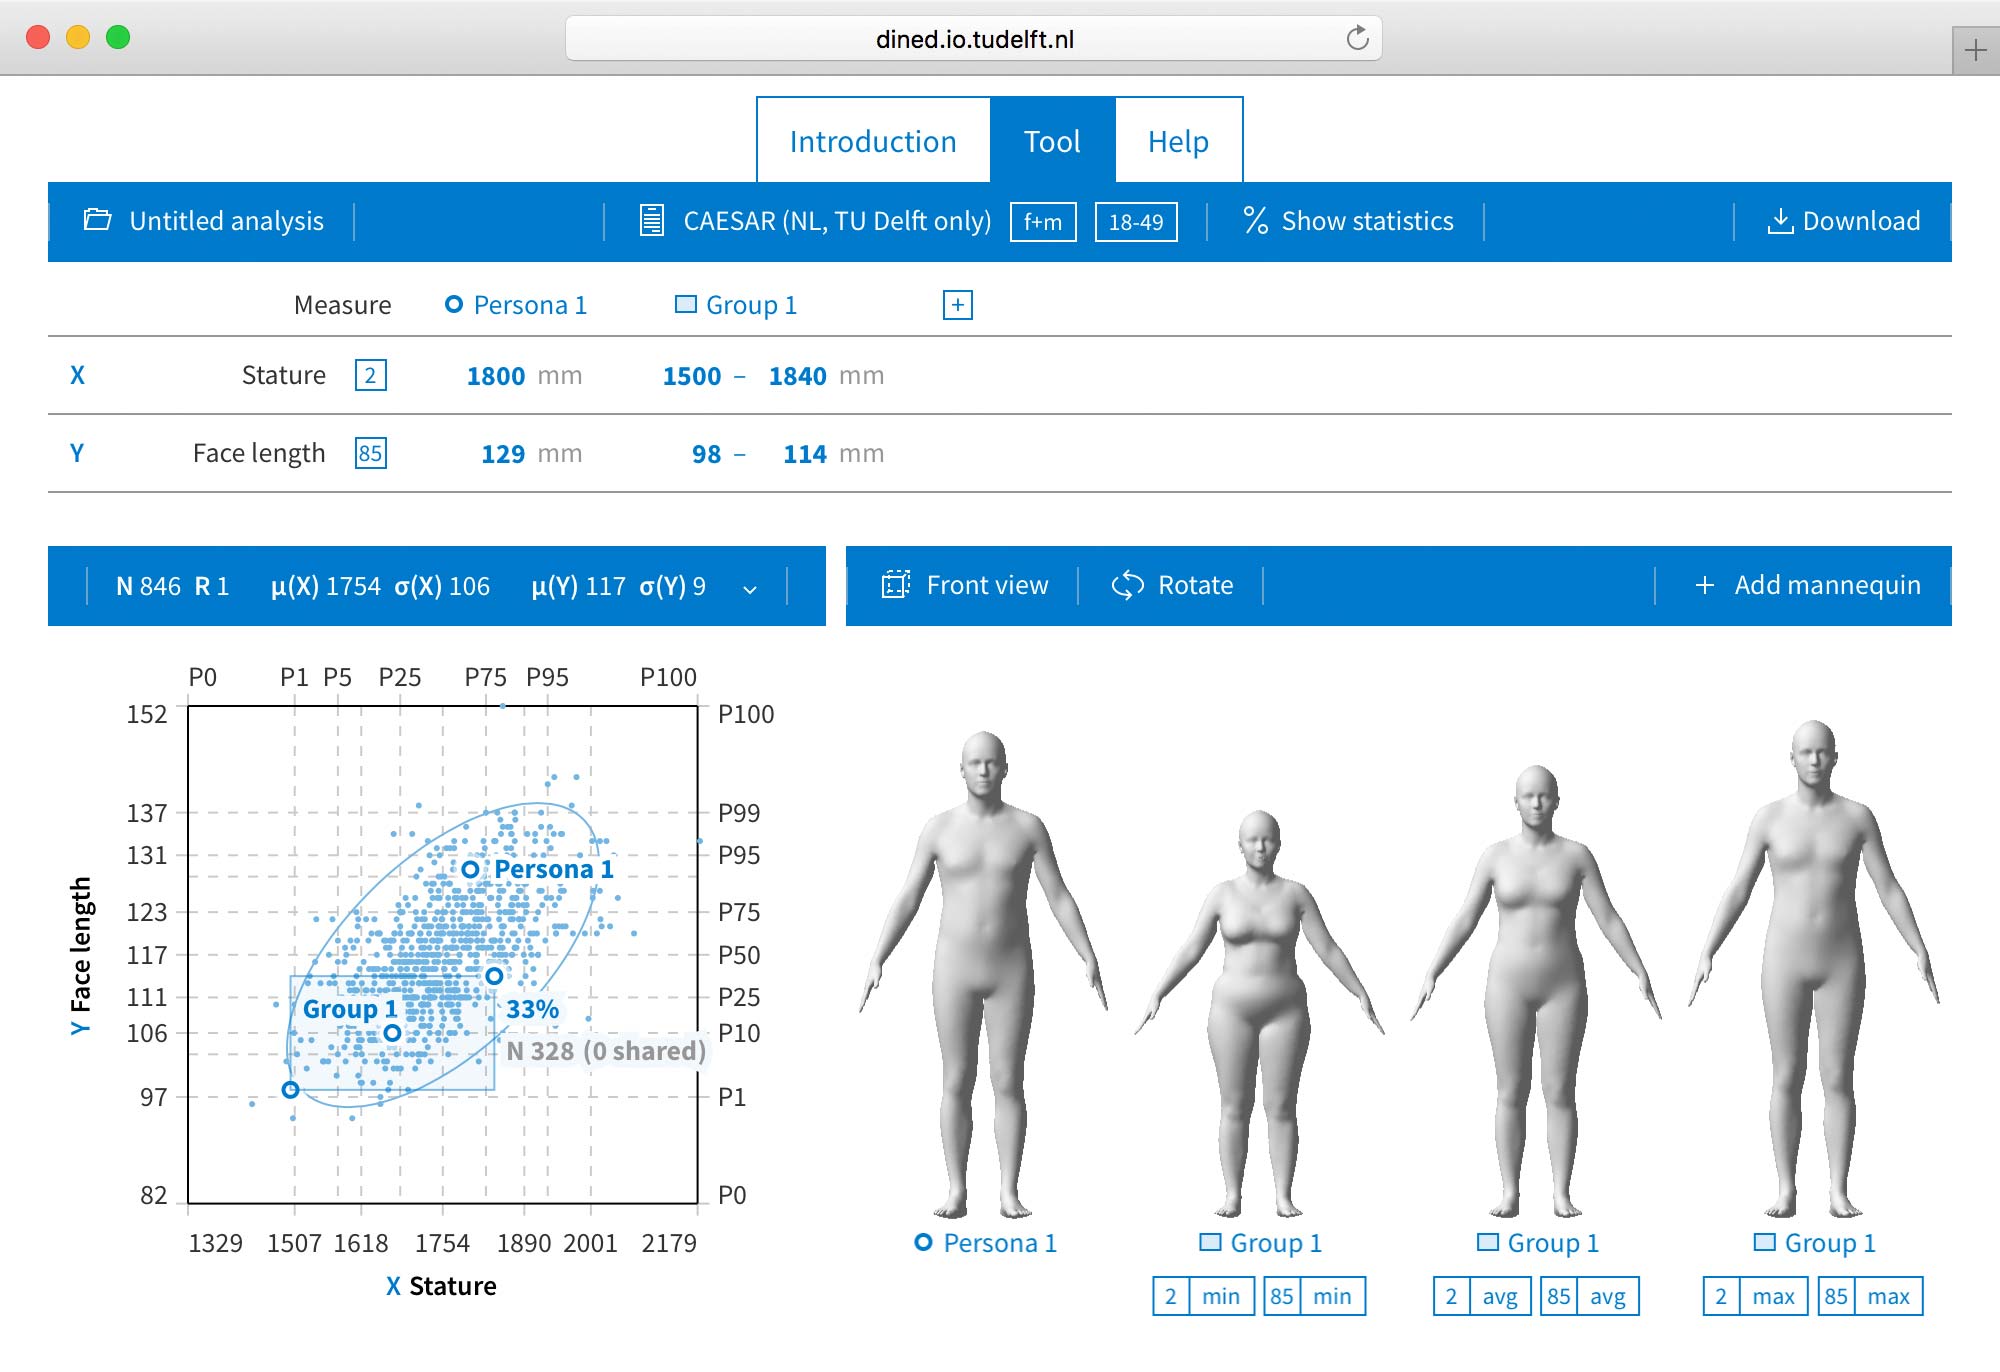
The Mannequin user interface consists of a number of panels:
- Central in the toolbar, we have the population panel, where the study population is chosen. It also provides functionality for selecting an age group or range and including one or both genders.
- Below the toolbar, we have the persona panel. Here, the set of key measures is selected and a number of personas or groups can be defined. In order to create a 3D manikin, you have to fill in all the measures for that persona or group.
- At the bottom left, we have the scatter plotting panel. This plot allows you to explore the data distribution and correlation for the different key measures. The plot also shows the position of the manikins or groups within the population.
- At the bottom right, we have the 3D view panel for interactive 3D visualisation of the manikins. Tools are provided for manipulating the camera to inspect the manikins from several angles. For groups, you can here add manikins to show different shape variations within the groups.
- On the right of the toolbar, we have the download panel to download manikin data, scatter plots, and STL-files of the manikins.
- As with other DINED tools, there is an analyses panel, on the left at the toolbar, providing functionality to save your analyses for later reference.
More information
More information about the inner workings of the Mannequin tool can be found in the documentation section: Mannequin.
Selecting a population
Using Mannequin starts by selecting a relevant population and a set of key measures.
Selecting a population
- In the toolbar, click the button showing "Population" or the currently selected population.
- Select a study that represents the right population by clicking one in the list.
Note: Studies approximate the population they represent using a sample. Various factors including sample size, age distribution and sex ratio may affect the validity of results.
Note: Populations with a lock icon next to their name are locked. To use these populations you need to sign in or create a free account.
Filtering a population by sex
- In the toolbar, click the button showing "Population" or the currently selected population.
- Select either "male" or "female" to limit the population to either sex or select "mixed" to include both male and female individuals.
Note: Data for mixed populations assumes an equal distribution between male and female individuals (unless the study uses a different distribution). This may not be the population's true ratio of men and women.
Filtering a population by age
- In the toolbar, click the button showing "Population" or the currently selected population.
- Do any of the following:
- Select an age group.
- Use the range slider to select a custom age range.
Selecting key measures
Typically there are a number of body measures which play a prominent role when sizing a specific product, which we refer to as key measures. For example in the design of a cycling helmet, head breadth, depth, and circumference would be a reasonable set of key measures. We use the set of key measures to control the exploration of the 3D variatons of the body.
To select the key measures:
- In the "Measure" section of the persona table, click the currently selected measure to get information about this measure or to change the measure. Click "Add measure" to extend the key measure set with an additional measure.
- Click any of the measure groups in the right column to view the available measures.
- Select a measure by clicking one in the graphic or in the list. Measures available for the selected population have a blue border. Note: Not all measures might be shown in the graphic. Additional measures are shown in a list below the graphic.
-
If you have not selected a population yet, you will be shown the list of all possible measures. Note that adding measures before selecting a population can result in an invalid measure set, as some measures might not be available for the selected population (shown in light gray).
- To remove a measure from the set, click the measure and then click on the "-" sign in front of it.
Note: Measures with a lock icon instead of a number or with a lock icon next to their name are locked. To use these measures you need to sign in or create a free account.
Selecting axes for the population scatter plot
In case the set consists of two or more measures, a population scatter plot can be generated:
- Add a first measure. It will be assigned to the X-axis automatically.
- Add a second measure. It will be assigned to the Y-axis automatically and a scatter plot with these two measures will be generated.
- Do any of the following:
- Switch the axes by clicking on the "X" or "Y" sign next to the measure and selecting the other axis.
- In case the set contains more than two measures, click on the "..." sign in front of an other measure and select either "X" or "Y" to assign that measure to the respective axis.
Looking up background information on populations and measures
- In the "Population" section of the toolbar or the "Measures" section of the persona table, click any selected population or measure.
- Information on the currently selected measure or population is displayed below the list or graphic. To view information on another population or measure, hover the pointer over that population or measure.
Creating personas
After selecting a population and a set of (two or more) key measures, Mannequin will draw a scatter plot of the population individuals. It is advised to inspect the population from different views, by going through the different measures and assigning them to the X- or Y-axes. The scatter plotting is essential in exploring the variation and correlation between the different measures.
To explore the variation of 3D body shapes present within the population, you can add and define a number of personas or groups:
- a persona is a single 3D body shape, positioned somewhere in the population, and is defined by supplying a value for each of the key measures. A persona is shown in the 3D view panel as a single 3D manikin.
- a group is a range of 3D body shapes, covering a rectangular (or box-like) part of the population, and is defined by supplying a range of values for each of the key measures. Initially, a group is shown in the 3D view panel as one 3D manikin that corresponds to the middle of the group/box. Additional manikins from the group can be added to the 3D viewing panel. Group manikins can be manipulated in the 3D view panel to show specific body variations within the group.
Groups can be used to subdivide the population in several regions, e.g. small, medium, large, which could correspond to product sizes. The various 3D manikins for a group then give an idea of the body shape variation that the product size should be able to accomodate.
Adding a persona
- Click the + button next to the rightmost persona or group name (or on the right of "Measure" in case there are no personas or groups yet).
- Click "Add persona".
- For each measure, enter the measurement value. The cross hairs in the scatter plot panel can be used to derive the measurement values, e.g. corresponding to certain percentiles.
- The position of the persona in population is shown in the scatter plot panel.
- The 3D manikin corresponding to this persona is shown in the 3D viewing panel.
Adding a group
- Click the + button next to the rightmost persona or group name (or on the right of "Measure" in case there are no personas or groups yet).
- Click "Add group".
- For each measure, enter the measurment range (from - to). The cross hairs in the scatter plot panel can be used to derive the measurement ranges, e.g. corresponding to certain percentile ranges.
- The portion of the population that the group covers is shown with a shaded rectangle in the scatter plot panel. The group region is in fact a box with dimension equal to the number of key measures. By selecting different measures for the X- and Y-axis, you see different 2D projections of this box.
- The 3D manikin corresponding to the center position of this group is shown in the 3D viewing panel. The body variation that this manikin represents can be changed by clicking the blue boxes below the manikin. There is a blue box for each of the key measures and you can choose that the manikin is at the minimum, average, or maximum of the range for that measure.
Additional manikins for a group can be added by clicking "+ Add mannequin" in the toolbar of the 3D viewing panel and selecting the group for which to add a manikin. Manikins can be removed from a group by hovering over the group name below the manikin and click the "-" sign.
Removing a persona or group
- Hover over the name of the persona or group.
- Click the - button.
Note: You can view the percentile values for the entered measurement values by clicking on the "% show statistics" button in the toolbar.
Saving and downloading
Mannequin makes it easy to use your analyses in your projects. You can save analyses to review or edit them later and you can download the plots you create as images to include in documents or presentations. Furthermore, you can download the generated 3D manikins as STL-files for further use in computer-aided design software.
Downloading the personas and groups table
- Click the download button in the toolbar.
- Click the "Data Table"-tab.
- Click the download button to download the table in csv-format.
Downloading a scatter plot
- Click the download button in the toolbar.
- Click the "Chart"-tab.
- Select the type of image to download.
- Enter width and height values for the image. Note: adjusting the width and height will affect the scale of the chart in SVG images, for PNG images scale is fixed.
- Click the download button.
- Depending on your browser, the graph image will download or you may need to manually save the image using your browser's save or save as command.
Downloading the 3D manikins
- Click the download button in the toolbar.
- Click the "3D Model"-tab.
- Click the download button to download a zip-file containing all manikins as STL-files.
Saving your analysis
To save a single analysis on your current computer:
- Mannequin will automatically save your analysis whenever you close or leave the page. Note: your analysis will not be saved if your are using your browser's 'Private browsing' mode.
To save one or multiple analyses that you may access by logging in:
- Click the analysis button in the toolbar.
-
If you have not already done so, or if you want to change the name, choose a name for your analysis. Click the "..." button and then click "Rename".
- Click the save button.
Viewing a saved analysis
- Click the analysis button in the toolbar.
- Select any analysis in the list to load it.
Reverting an analysis to an older version
An analysis manually saved in your account may be reverted to the last manually saved version.
- Click the analysis button in the toolbar.
- Look at the last saved date to see when the document was last saved manually.
- Click the revert to last saved button to revert it to this version.